Summarizing Data:
DIMENSION REDUCTION
Dimension reduction is a way of devising one or two variables to
summarize the information contained in a whole lot of other
variables. The three methods of dimension reduction are principal
components analysis, factor analysis, and cluster
analysis
 PRINCIPAL COMPONENTS ANALYSIS
When you take lots of different measurements in a study,
you sometimes want to combine them in some way to derive just one or
two measures that summarize some aspect of the data. For example, you
might have five different measures of body size, but would like to
have simply one or two summary measure that combine the five. The
summary measures are provided by principal components analysis.
All you do is tell the stats program what variables you want it to
analyze. It comes up with a linear combination of the variables that
somehow captures the biggest amount of common variation in all of
them. It then goes on to produce another linear combination that
captures the biggest amount of variation in what's left, and so. If
you start with three variables, you'll get three principal
components. The nice thing about them is, they are not correlated
with each other, so they represent three totally independent
measures. Exactly what they represent in reality has to be decided by
looking at the weighting factors that the stats program
derives to make the principal components. Sometimes it's not obvious
that they represent anything meaningful, and you might have to
abandon this approach.
 FACTOR ANALYSIS
Here you want combinations of variables with equal
weighting, and you're generally not concerned if the resulting
composites are correlated. This method is used by psychologists (or
their statisticians) to derive distinct dimensions of the psyche from
subsets of items in multi-item questions. Factor analysis divides the
items into subsets such that items correlate well within each subset
but not so well between subsets. Each subject then gets a mean score
for the items in each subset . The researcher has to decide what to
call the mean scores by looking at the wording of the items.
It's a few years since I did factor analysis, which is why this
section is so short! If there is a demand for it, I will include the
detail on such things as promax rotation and deciding where to draw
the line for inclusion of variables in a factor.
 CLUSTER ANALYSIS
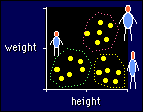
 This is
a particularly severe form of dimension reduction that reduces all
variables and data down to one variable with only a few values (e.g.
group A, group B, and group C). It's easiest to understand from the
example in the figure, which shows heights and weights for a bunch of
people who obviously fall into three groups or "clusters":
You can let the stats program decide on the number of clusters, or
you can force it to find as many as you like. The program decides
which observations belong to which cluster by minimizing the
distances between points in each cluster. You are not restricted to
two variables, of course. It's impossible to imagine clusters for
more than three variables (unless you are an Einstein), but the stats
program handles it without any problem.
Cluster analysis is used in market research, where you want to
identify a few major target groups in a population. And it's a cool
way of identifying groups in the population with particular
lifestyles. Variables used in the cluster analysis might be age, sex,
socio-economic status, level of physical activity, measures of diet,
and so on.
Go to: Next · Previous · Contents · Search
· Home
resources=AT=sportsci.org · webmaster=AT=sportsci.org · Sportsci Homepage · Copyright
©1997
Last updated 25 April 97
 This is
a particularly severe form of dimension reduction that reduces all
variables and data down to one variable with only a few values (e.g.
group A, group B, and group C). It's easiest to understand from the
example in the figure, which shows heights and weights for a bunch of
people who obviously fall into three groups or "clusters":