Summarizing Data:
EFFECT
STATISTICS continued
 Difference
in Frequency
 We
seldom use the raw counts of something when we compare frequencies. In the example
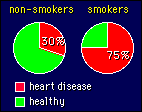
shown on the right, there may have been 600 non-smokers who had heart disease,
out of a sample of 2000 non-smokers altogether, so we usually talk about 30% of
the non-smokers having heart disease. A percent frequency makes it easier to compare
the rate of heart disease in other groups, for example smokers. But how do we
now actually compare the frequencies? The simplest way is to subtract them: the
difference in rate of heart disease is 45%. I think that's the best way, but it
is not the usual way. Instead, researchers usually divide one frequency by the
other. In the example, smokers would be 75/30, or 2.5 times as likely to develop
heart disease as non-smokers. Or to put it another way, the relative risk
of developing heart disease for smokers is 2.5. If the frequency of heart disease
was the same in both groups, the relative risk would be 1.0, and if the frequency
was less in smokers, the relative risk would be less than 1.0.
It's hard to put a figure on what are considered small, medium and large differences
between the frequencies of something in two groups, because it depends on the
frequencies. If one group has about 50% with a characteristic, a frequency of
60% or 40% in the other group can be considered small. That difference corresponds
to a relative risk of about 1.2 (or 0.8, depending which way around the frequencies
are). Once the frequencies get low (e.g. 1% in one group), relative risks have
to be 2 or more before people get excited.
Notice that the two groups differ in exposure to something that might
cause the disease. A somewhat different statistic, the odds ratio, is
used when the basis of the grouping is whether subjects already have the disease:
 in
other words, when the groups are cases and controls. In the example
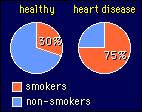
shown, the odds of being a smoker in the heart-disease group are 75/25 = 3.
Similarly, the odds of being a smoker in the healthy group are 30/70 = 0.43.
The odds ratio is therefore 3/0.43 = 7. Interpret this statistic as "seven
people with heart disease smoke for every healthy person who smokes". Or,
if you had two people in front of you, a healthy person who smokes and a person
with heart disease, you would break even in the long run by betting at odds
of 7:1 that the person with heart disease is a smoker. Fine, but I still have
trouble getting my brain around this statistic. Are those odds good or bad,
in terms of the effect of smoking on heart disease? I don't know. I guess I
don't work with this statistic enough to have a feel for it. (I used to have
here "seven smokers have heart disease for every one smoker who doesn't" or
"if you are a smoker, odds are 7 to 1 that you have heart disease", but these
interpretations are wrong. Thanks, Chris Rhoads!).
in
other words, when the groups are cases and controls. In the example
shown, the odds of being a smoker in the heart-disease group are 75/25 = 3.
Similarly, the odds of being a smoker in the healthy group are 30/70 = 0.43.
The odds ratio is therefore 3/0.43 = 7. Interpret this statistic as "seven
people with heart disease smoke for every healthy person who smokes". Or,
if you had two people in front of you, a healthy person who smokes and a person
with heart disease, you would break even in the long run by betting at odds
of 7:1 that the person with heart disease is a smoker. Fine, but I still have
trouble getting my brain around this statistic. Are those odds good or bad,
in terms of the effect of smoking on heart disease? I don't know. I guess I
don't work with this statistic enough to have a feel for it. (I used to have
here "seven smokers have heart disease for every one smoker who doesn't" or
"if you are a smoker, odds are 7 to 1 that you have heart disease", but these
interpretations are wrong. Thanks, Chris Rhoads!).
Coming up next is the important question of how
big is big in effect statistics.
Go to: Next
· Previous
· Contents ·
Search
· Home
webmaster
Last updated 16 March 02
 in
other words, when the groups are cases and controls. In the example
shown, the odds of being a smoker in the heart-disease group are 75/25 = 3.
Similarly, the odds of being a smoker in the healthy group are 30/70 = 0.43.
The odds ratio is therefore 3/0.43 = 7. Interpret this statistic as "seven
people with heart disease smoke for every healthy person who smokes". Or,
if you had two people in front of you, a healthy person who smokes and a person
with heart disease, you would break even in the long run by betting at odds
of 7:1 that the person with heart disease is a smoker. Fine, but I still have
trouble getting my brain around this statistic. Are those odds good or bad,
in terms of the effect of smoking on heart disease? I don't know. I guess I
don't work with this statistic enough to have a feel for it. (I used to have
here "seven smokers have heart disease for every one smoker who doesn't" or
"if you are a smoker, odds are 7 to 1 that you have heart disease", but these
interpretations are wrong. Thanks, Chris Rhoads!).
in
other words, when the groups are cases and controls. In the example
shown, the odds of being a smoker in the heart-disease group are 75/25 = 3.
Similarly, the odds of being a smoker in the healthy group are 30/70 = 0.43.
The odds ratio is therefore 3/0.43 = 7. Interpret this statistic as "seven
people with heart disease smoke for every healthy person who smokes". Or,
if you had two people in front of you, a healthy person who smokes and a person
with heart disease, you would break even in the long run by betting at odds
of 7:1 that the person with heart disease is a smoker. Fine, but I still have
trouble getting my brain around this statistic. Are those odds good or bad,
in terms of the effect of smoking on heart disease? I don't know. I guess I
don't work with this statistic enough to have a feel for it. (I used to have
here "seven smokers have heart disease for every one smoker who doesn't" or
"if you are a smoker, odds are 7 to 1 that you have heart disease", but these
interpretations are wrong. Thanks, Chris Rhoads!).  We
seldom use the raw counts of something when we compare frequencies. In the example
shown on the right, there may have been 600 non-smokers who had heart disease,
out of a sample of 2000 non-smokers altogether, so we usually talk about 30% of
the non-smokers having heart disease. A percent frequency makes it easier to compare
the rate of heart disease in other groups, for example smokers. But how do we
now actually compare the frequencies? The simplest way is to subtract them: the
difference in rate of heart disease is 45%. I think that's the best way, but it
is not the usual way. Instead, researchers usually divide one frequency by the
other. In the example, smokers would be 75/30, or 2.5 times as likely to develop
heart disease as non-smokers. Or to put it another way, the relative risk
of developing heart disease for smokers is 2.5. If the frequency of heart disease
was the same in both groups, the relative risk would be 1.0, and if the frequency
was less in smokers, the relative risk would be less than 1.0.